Cloud-native monitoring
Get real-time visibility into your cloud infrastructure and applications with Microtica's cloud-native monitoring, from live metrics and logs to alerts.
Cloud-native monitoring gives you real-time visibility into the performance and health of your cloud infrastructure and applications. Microtica collects, analyzes, and visualizes this data so you can find and fix issues before they affect your users.
What is cloud-native monitoring?
Cloud-native monitoring tracks the performance and health of cloud infrastructure and applications. It covers the collection, analysis, and visualization of data that can surface problems before users are affected.
A cloud-native monitoring tool is built to run inside cloud environments and use their native capabilities. Microtica is one example, with monitoring and troubleshooting built into its cloud delivery platform. It provides real-time visibility into your cloud infrastructure and applications, with alerts to help you keep them healthy.
Why monitoring matters
A reactive approach is no longer enough. To prevent outages, keep performance high, and keep users happy, you need to stay ahead of problems. Microtica helps you:
- Gain complete visibility: See your entire cloud ecosystem, from infrastructure to applications, in one place.
- Get actionable insights: Turn raw data into information that helps you spot performance bottlenecks and anomalies.
- Troubleshoot faster: Use log analysis and error visualization to pinpoint issues quickly.
- Collaborate as a team: Share environment views to improve teamwork and incident response.
- Alert proactively: Stay informed with timely alerts on critical events.
Monitoring features in Microtica 3.0
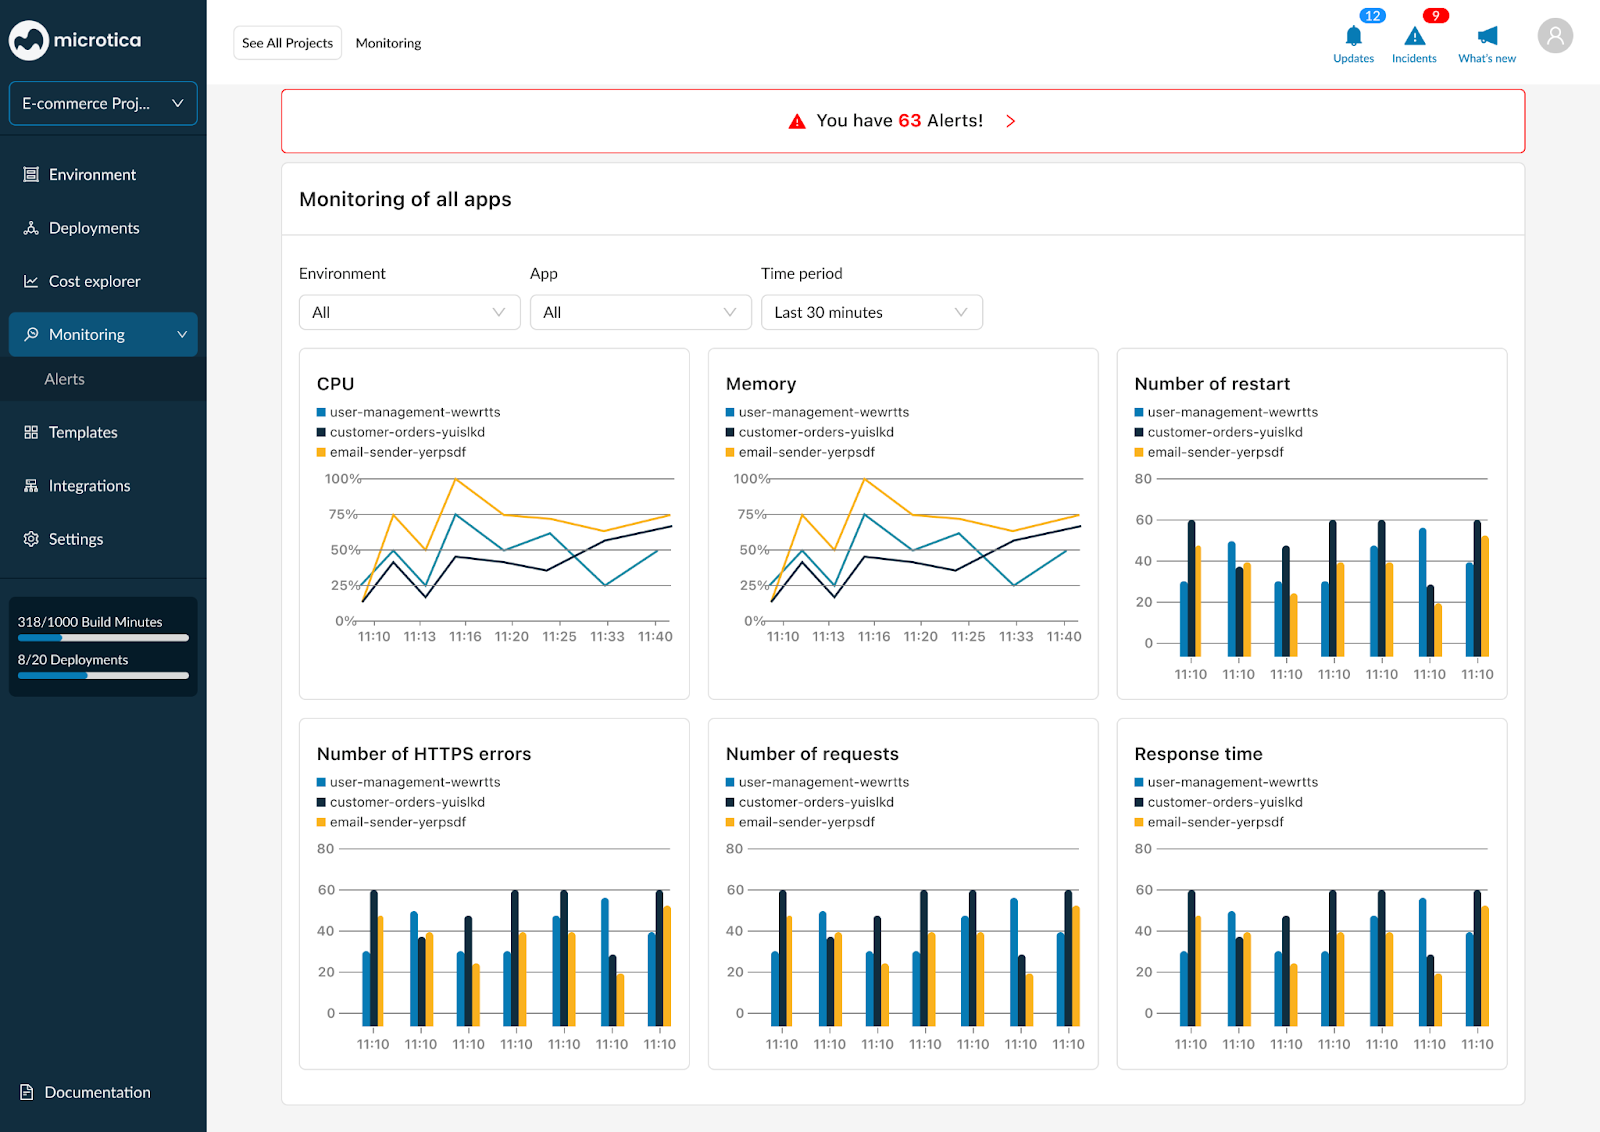
Visibility
- Monitor infrastructure components (such as Kubernetes clusters) and application performance metrics in real time.
- See CPU, memory, disk I/O, network traffic, and other key metrics.
- Identify abnormal resource usage, slowdowns, and errors.
Insights
- Correlate metrics and logs to understand root causes.
- Detect anomalies and trends with analytics.
- Prioritize issues by impact and urgency.
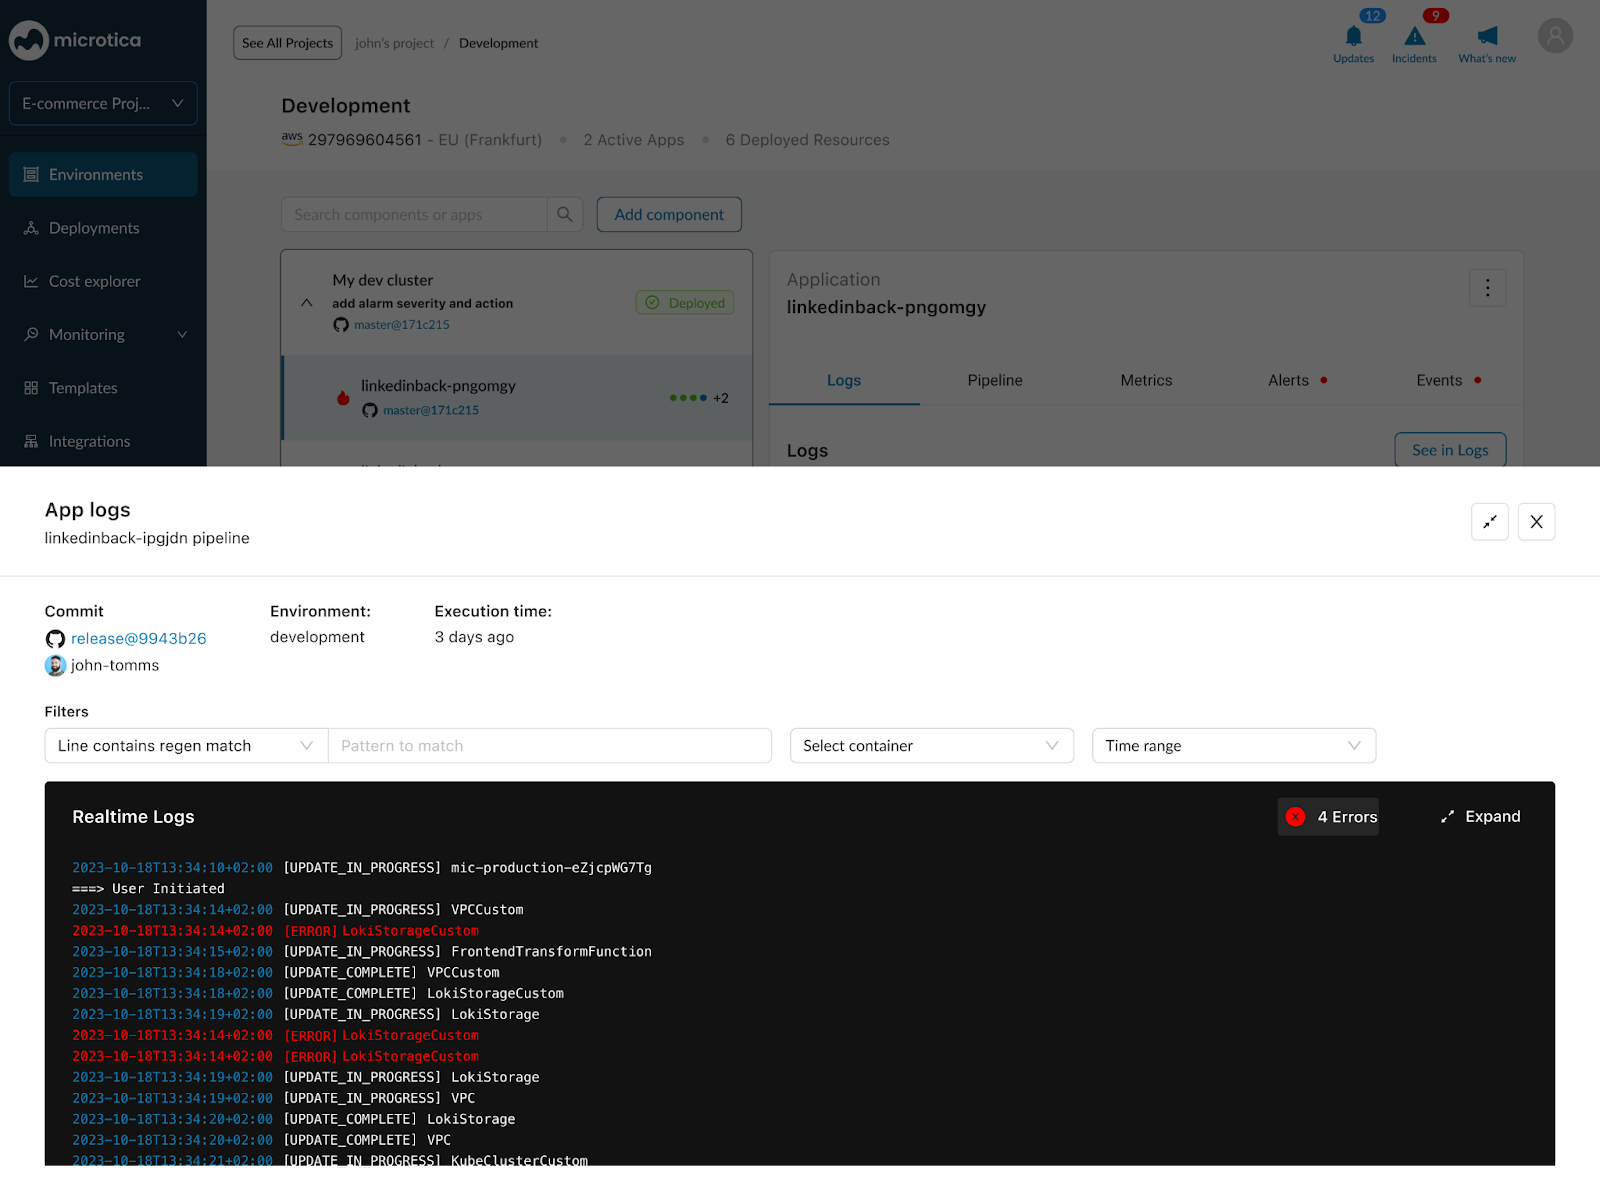
Troubleshooting
- Search and filter logs.
- Visualize errors with color-coded indicators.
- Identify the root cause of problems quickly.
Collaboration
- Share environment overviews with team members.
- Collaborate on incident response and troubleshooting.
Alerting
- Customize alerts based on specific conditions.
- Receive notifications through various channels (email, SMS, and more).
- Get a centralized view of your incidents.
With real-time metrics, recommendations, and easy-to-apply fixes, Microtica helps you make decisions, use resources efficiently, and manage your cloud.
Next steps
Monitoring and cost
Monitor the health and performance of your cloud infrastructure and applications with Microtica, and optimize your AWS spending with cost reports.
Metrics
Monitor Kubernetes and custom AWS service metrics in Microtica, set alarms on thresholds, and learn how each metric is calculated to troubleshoot faster.