Cost dashboard
Visualize and analyze your AWS costs per environment with the Microtica cost dashboard: current spend, service distribution, forecasts, and year-to-date trends.
The cloud cost dashboard is an interactive view of your AWS costs. Use it to understand cost trends, service distribution, and cost forecasts for budget planning.
The cost dashboard is accessible per environment, and each environment is associated with a specific AWS account. This lets you analyze AWS spending in a focused, granular way.
Accessing the cost dashboard
To open the cloud cost dashboard:
- Log in to your Microtica account.
- Go to your Project and choose the environment connected to the AWS account you want to analyze.
- Click the Cost Dashboard tab.
Components of the cost dashboard
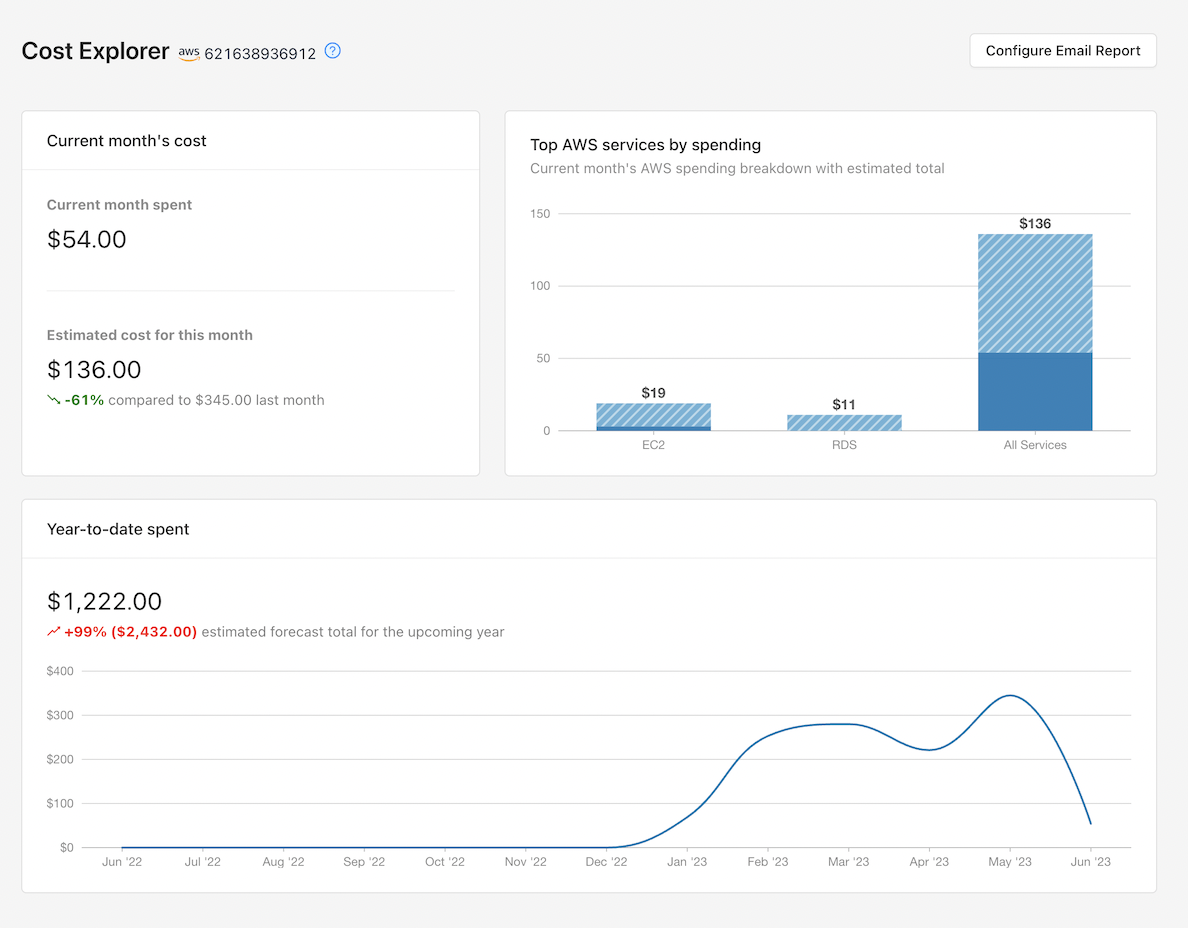
- Current Month Spend: Shows your AWS spending for the current month — an immediate snapshot of your costs.
- Service Distribution Analysis: Shows how your costs are distributed across AWS services, and the current vs. estimated total cost per service. This helps you identify which services drive your expenses.
- Accurate Cost Forecasts: Predicts your AWS costs for the upcoming months and year, based on historical data. This helps with budget planning and cost control.
- Year-to-Date Graph for Trends Analysis: Provides a year-to-date view of your AWS costs, so you can analyze spending patterns over time.
Usage guidelines
- Review the cost dashboard for your environment regularly to stay informed about AWS spending trends.
- Use the forecasting data to plan your budget and allocate resources efficiently.
The cost dashboard gives you a single place to manage and optimize AWS costs. Analyzing spending trends, identifying cost drivers, and using forecasts all support better cost management and resource allocation in your AWS environment.
Next steps
Cost reports
Get weekly or monthly AWS cost reports in Microtica, with month-to-date and estimated costs, cost by account, waste advisor flags, and new resources.
Automated saving schedules
Cut AWS costs with automated saving schedules in Microtica: start and stop EC2 and RDS instances on a schedule to save up to 60% in non-production environments.