Cost reports
Get weekly or monthly AWS cost reports in Microtica, with month-to-date and estimated costs, cost by account, waste advisor flags, and new resources.
Cost reports give you detailed insight into your AWS costs. They are an essential way to monitor and analyze your cloud spending, so you can make data-driven decisions to optimize costs.
How to receive cloud cost reports
On any pricing plan, you get detailed monthly or weekly cloud cost reports by deploying on your AWS account with Microtica.
By default, everyone on the project receives a weekly report of the cloud costs on the connected AWS account.
Configuring cloud reports
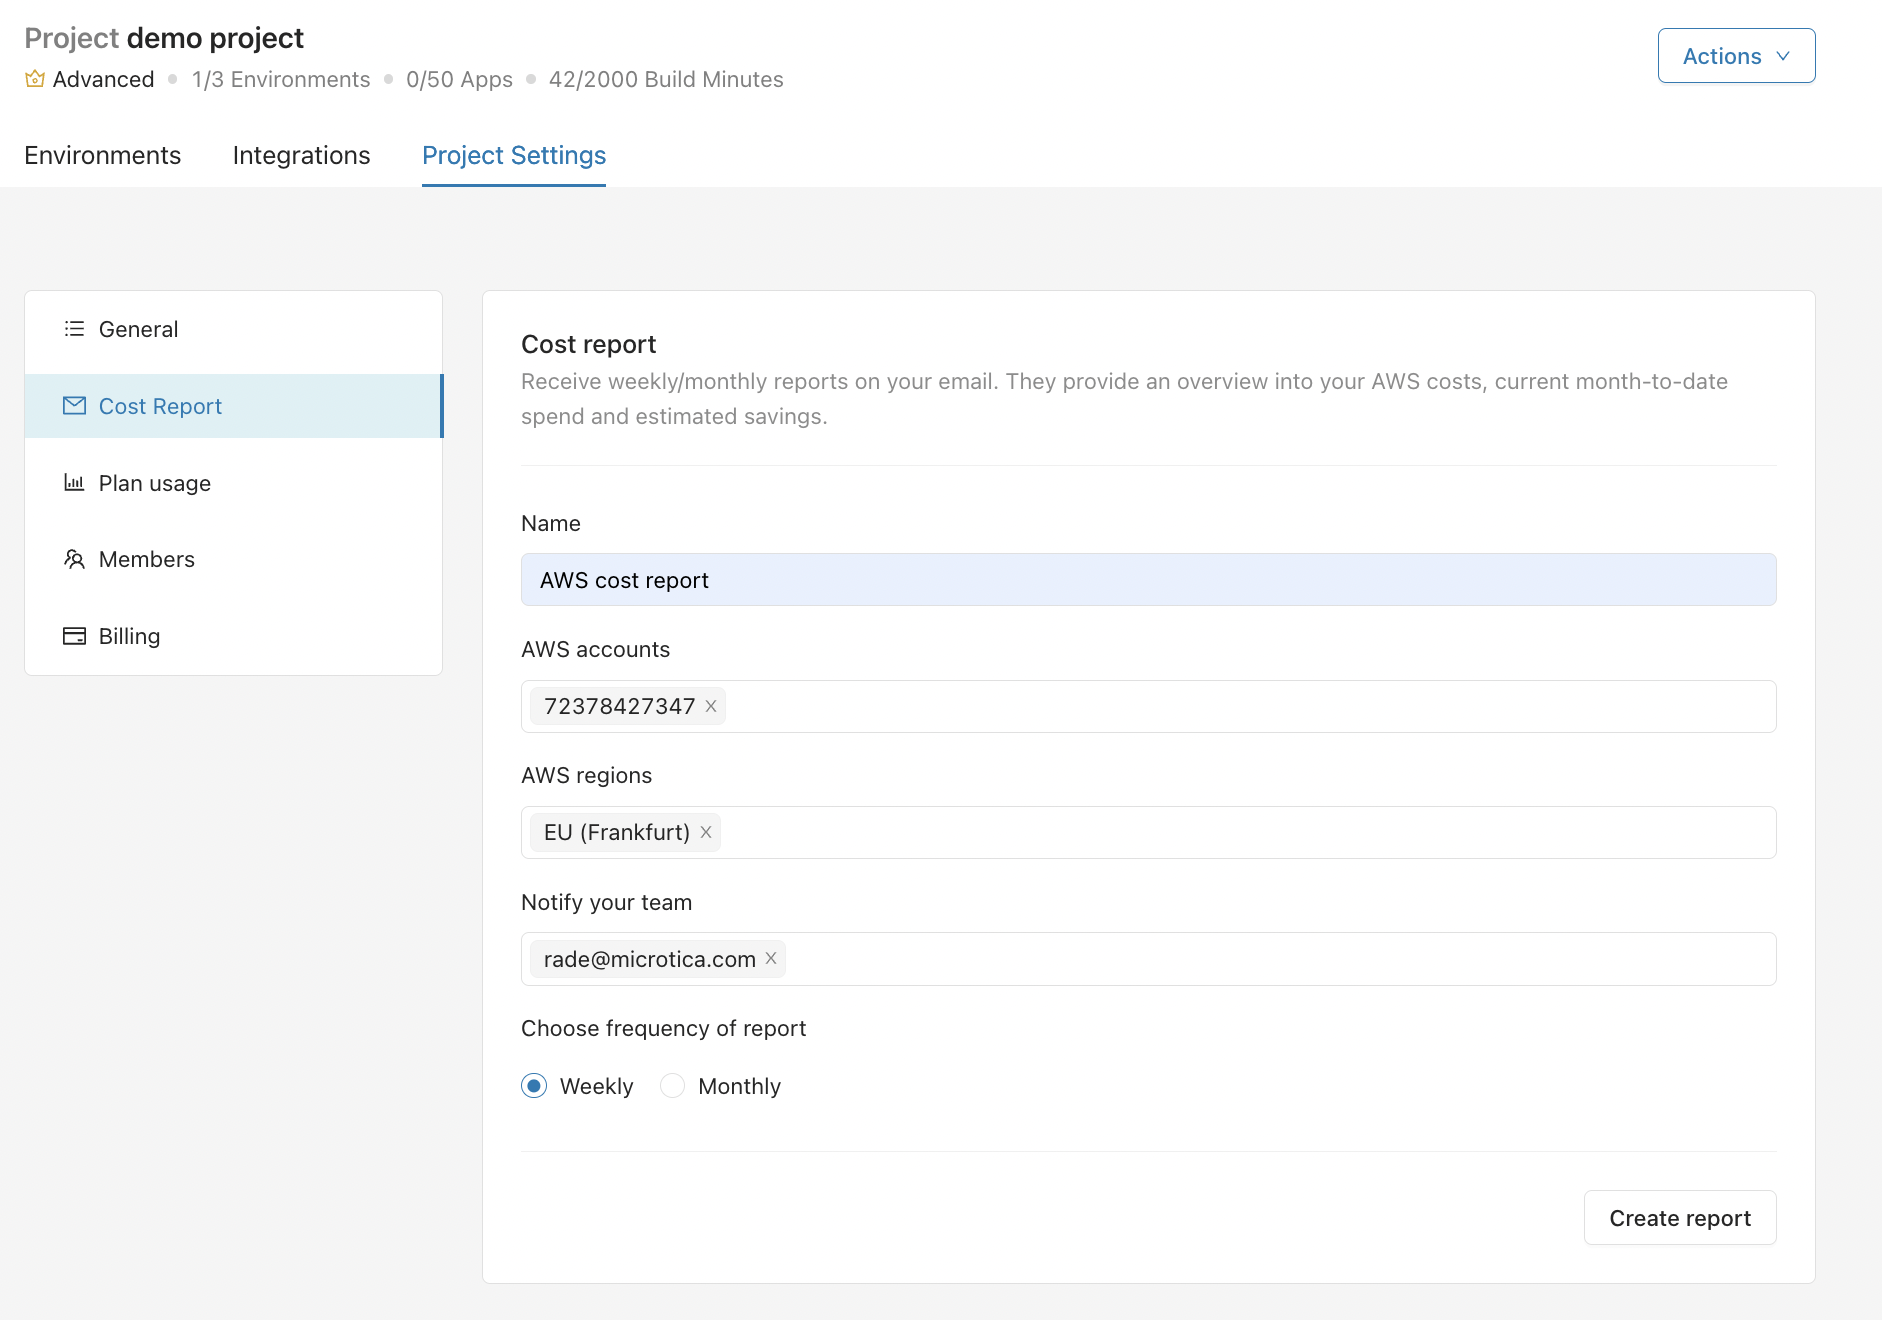
To change the default and configure the report, go to Project Settings → Cost Report in the left panel.
Here you can specify:
- Cloud report name
- Which AWS account and region to report on
- Report frequency: weekly or monthly
- Who receives the reports by email
Cloud cost report email
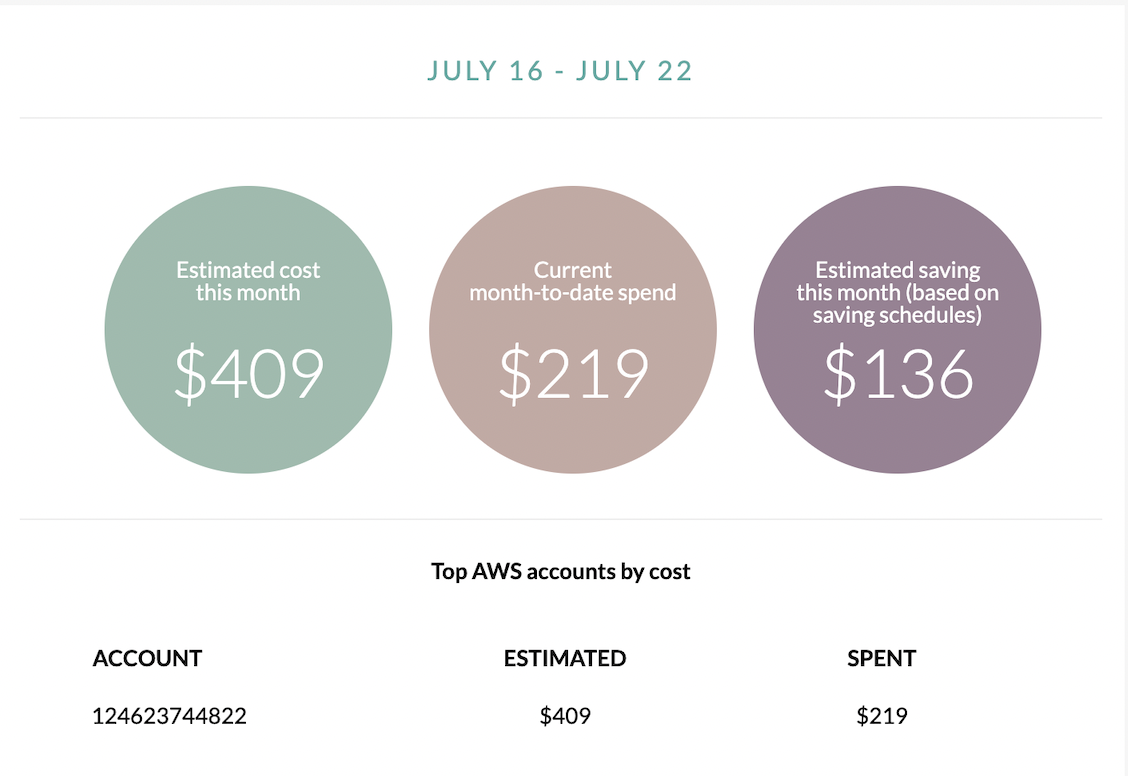
Cost reports come weekly and monthly, with a detailed breakdown of your AWS costs over each interval.
Each report includes cost metrics such as:
- current month-to-date cost,
- estimated cost for the month,
- cost by AWS account,
- estimated savings for the month (based on the active saving schedules).
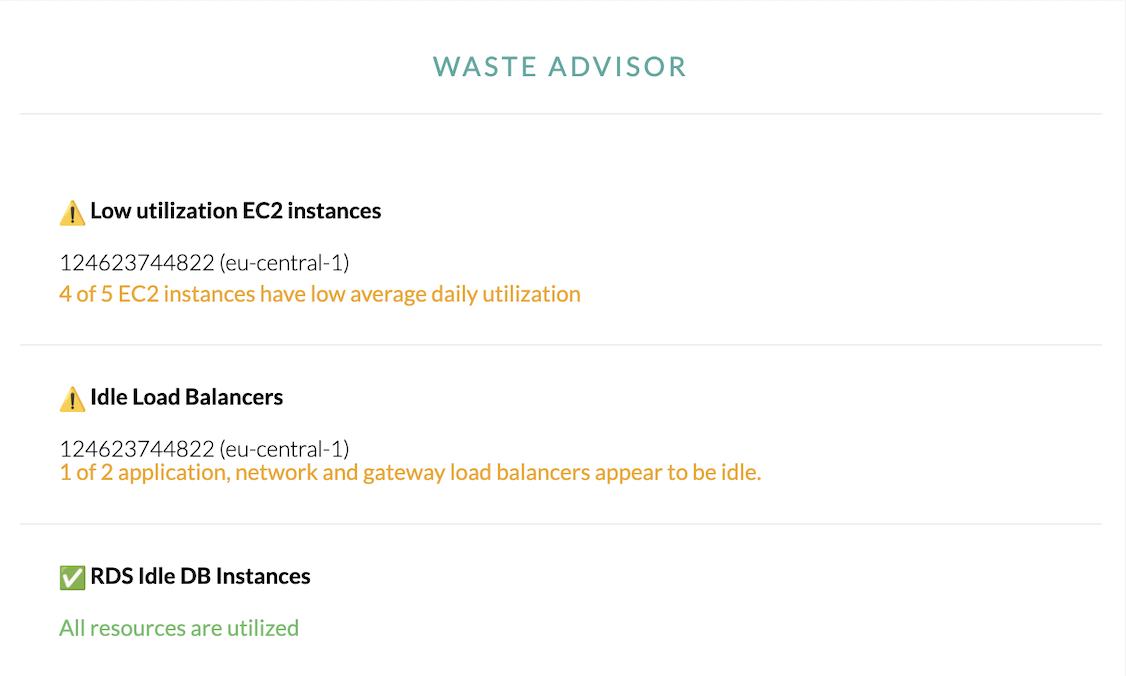
Waste advisor
The report includes a Waste Advisor section that drives cost savings by surfacing resources that are underutilized, idle, or no longer needed.
- Low Utilization EC2 Instances: Waste Advisor analyzes your EC2 instances to find those with low utilization. These instances often add unnecessary cost. By flagging them, Waste Advisor helps you decide whether to resize, consolidate, or terminate underutilized instances to optimize your infrastructure and reduce expenses.
- Idle Load Balancers: Idle load balancers incur cost without serving traffic. Waste Advisor flags them so you can act — for example, by modifying traffic distribution or terminating them — to remove redundant expenses.
- RDS Idle DB Instances: Waste Advisor also covers Amazon RDS instances. It highlights idle or underutilized database instances, helping you decide whether to rightsize, consolidate, or decommission them for significant cost reductions.
Taking action for cost savings:
Once Waste Advisor identifies potential waste, it provides recommendations that follow AWS cost optimization best practices. By following them, you can:
- Rightsize resources: Choose the appropriate instance types based on workload requirements, removing over-provisioning.
- Remove idle resources: Terminate or consolidate idle resources that add no value, reducing unnecessary expenses.
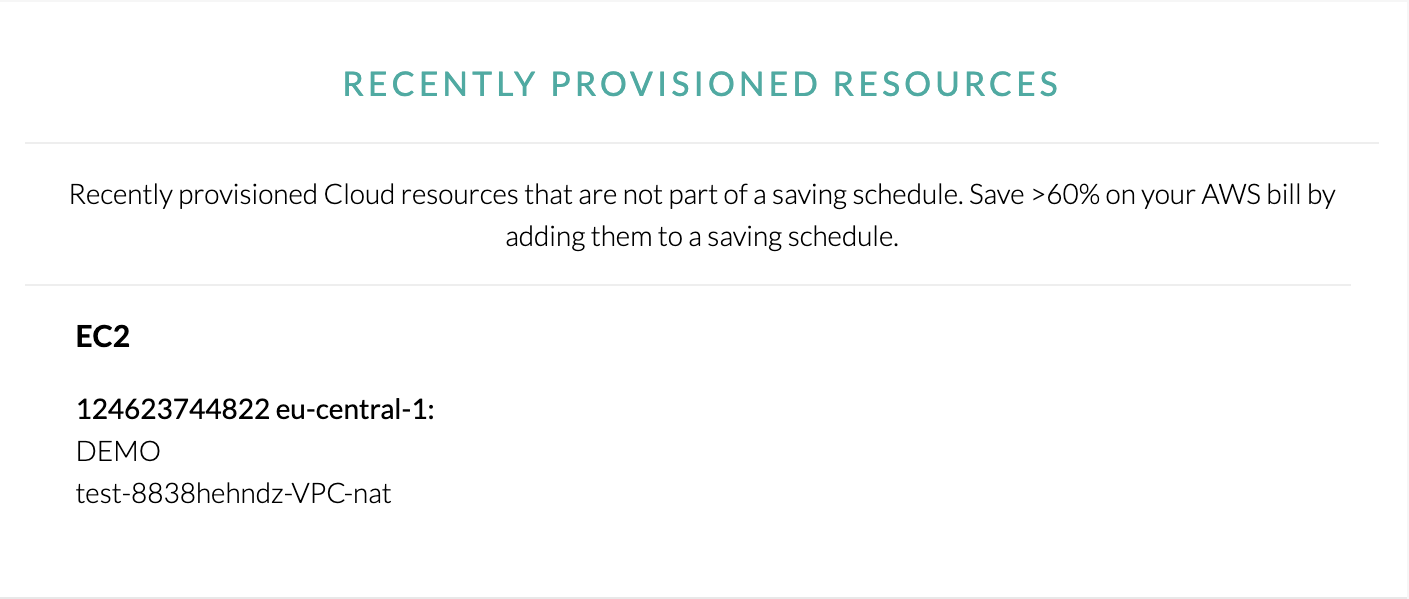
Recently provisioned resources
The Recently Provisioned Resources section in the cost report email shows new resources provisioned in your AWS environment. Knowing what was provisioned recently helps you assess the impact on your AWS costs and take any optimization actions.
Key information provided:
This section shows essential details about each recently provisioned resource, including:
- Resource Type: The type of resource provisioned, such as EC2 instances, RDS databases, S3 buckets, and so on.
- Resource Identifier: A unique identifier for the resource, to help with tracking and management.
- Resource name: The name of the provisioned resource, so you can find it easily in Microtica.
- Associated Tags: Any tags associated with the resource, to help with categorization and organization.
Taking action:
After reviewing the recently provisioned resources, you can take steps to optimize your AWS costs. This may involve analyzing the utilization and necessity of each resource, applying tags, and deciding whether to resize, terminate, or consolidate resources.
Reading cost reports is an ongoing process. Review your reports regularly, compare trends across timeframes, and adjust your optimization strategies accordingly.
Next steps
Cost optimization
Optimize your AWS costs with Microtica: cost reports, waste advisor recommendations, cost exploration dashboards, and automated saving schedules in one place.
Cost dashboard
Visualize and analyze your AWS costs per environment with the Microtica cost dashboard: current spend, service distribution, forecasts, and year-to-date trends.